
Check out the DEMO R SHINY DASHBOARD!
This is an open source project collaborated between NYC Data Science Academy and Fusion media (an ABC-Univision joint-venture).
Project Team:
–NYC Data Science Academy
Fangzhou Cheng (PM, Data Science Fellow)
Shu Yan (Data Science Fellow)
Alex Singal (Data Science Fellow)
–Fusion
Noppanit Charassinvichai (Data Engineer)
Introduction:
This project designs a program for charting the influencers and patterns of the Twitter community. The findings will be able to help online media companies identify their most important influencers on Twitter and understand their interests, patterns, and behaviors. Furthermore, recommendation systems can be built based on natural language processing of influencers’ Twitter timeline to suggest content to attract their attention.
Check out the DEMO R SHINY DASHBOARD!
Snippets of code are included in the post. Complete code can be found HERE.
(Below is a demo R Shiny App to showcase the analysis result of TOP 20 retweets in @thisisfusion timeline)
 Twitter Influencer Shiny App (1)
 Twitter Influencer Shiny App (2)
 Twitter Influencer Shiny App (3)
1. Background
Recommendation systems have been widely used by news media companies. Just like “Recommended for You” section of NYTimes.com, and “Recommendations” plugin on HuffPost Social News, personalizing the placement of articles on the apps and website has been used to guide news readers to find their most interested articles. The core of the recommendation systems is to recommend the right content to the right people at the right times. While a few recommendation algorithms (such as content-based method and collaborative filtering) are already in the market, this project serves as a basis to find out the influencers in social network, such as Twitter.
2. Fusion Data Sources
FUSION, a joint venture between Univision Communications Inc. and Disney/ABC, is a multi-platform media company that champions a young, diverse, and inclusive world. Social media referrals have contributed to over 90% of the web traffic of its online presence fusion.net. To better understand their social media market segments, two main data sources are used in this project: 1) Twitter API (tweets information related to @thisisfusion); 2) WordPress API (news article information with related tweet). They are all open source data, which makes the project reproducible. In the future, this model can be modified to analyze Facebook as well.
3. Identify the Superfans
Just like in real life, users on Twitter have different levels of influence to other people. Different users will get different attention and reaction even when sending out the same tweet. It is easy to understand intuitively, but how to quantify the influence? How to find out all the users who have the most influence for Fusion?

Two sets of metrics are implemented in this project:
Centrality Score (Mining One Tweet): Based on retweet history in time series, and the following relationship between retweet users, a simple influence graph can be drawn as following. Centrality score shows how important a user is within a retweet network.

library(igraph)

shinyServer(function(input, output) {

    # following relationships between retweeters
    # (whether a retweeter is following those who retweeted the same tweet before him)
    rtLinks <- reactive({
        rter_id <- c(fusion$id, rev(intersect(rter_id(), dir(paste(data_path, "friends", sep = "/")))))
        friendShip <- c()
        for(i in 2:length(rter_id)) {
            friend <- intersect(rter_id[1:(i-1)], read.csv(paste(data_path, "friends", rter_id[i], sep = "/"))$id)
            if(length(friend)) {
                friendShip <- rbind(friendShip, cbind(friend, rep(rter_id[i], length(friend))))
            }
        }
        friendShip <- data.frame(matrix(sapply(friendShip, function(x) rters$screenName[rters$id == x]), ncol = 2))
    })

    # centrality score
    alphaCentr <- reactive({
        centra <- sort(alpha_centrality(graph(t(rtLinks()[,c(2,1)])), alpha = input$alpha), decreasing = TRUE)
        score <- numeric(0)
        for (i in 1:length(names(centra))) {
          score[i] <- influence[influence$screenName==names(centra)[i],]$score[1]
        }
        centra <- data.frame(Name = names(centra), Centrality = centra, Influence = score)
    })
})
InfluenceFlow Score (Mining Twitter Community): Not limited to specific tweet, InfluenceFlow Score captures overall information flow in Fusion community. It is calculated by the product of a user’s number of followers and number of times mentioning @thisisfusion in their recent 400 tweets.

import pandas as pd
import numpy as np
import tweepy
import requests
import re
import time
from tweepy import OAuthHandler
from get_config import get_config

env = get_config()

consumer_key = env.get('CONSUMER_KEY')
consumer_secret = env.get('CONSUMER_SECRET')
access_token = env.get('ACCESS_TOKEN')
access_secret = env.get('ACCESS_TOKEN_SECRET')

auth = OAuthHandler(consumer_key, consumer_secret)
auth.set_access_token(access_token, access_secret)

api = tweepy.API(auth)


t = pd.read_csv('fetcher/top100.csv')

# print t.t_id[:3]
# 0    614807708575907840
# 1    618798114825220097
# 2    617840986006401024

def retweet_users_of_a_tweet(tweet_id):
    retweets = api.retweets(tweet_id, 100)
    return [rt.user.id for rt in retweets]

# print retweet_users_of_a_tweet(614807708575907840)
# 16877020

def t_all_tweets(user,n):
	result = []
	count = 0
	for x in range(n):
		tweets = api.user_timeline(id=user,count=200,page=x+1,include_rts=True)
		result += tweets
		count += 1
		if (x+1)%10 == 0:
			print 'sleep for 90 seconds'
			time.sleep(90)
		print count, 'of ', n, 'pages done'
	return result


def t_mentions(user):
	tweets = t_all_tweets(user, 2) # first 2 pages timeline, 16 pages max
	t_text = ''
	for t in tweets:
		t_text += t.text
	return len(re.findall('(@thisisfusion|@ThisIsFusion)', t_text)) # number of direct mentions + retweets

def t_user_rank(users):
	udic = {}
	count = 0
	for user in users:
		screen_name = api.get_user(id=user).screen_name
		follower = api.get_user(id=user).followers_count
		mention = t_mentions(user)
		udic[screen_name] = [follower, mention, (follower*mention)]
		count += 1
		print count, 'of', len(users), 'users added into dictionary'
		if count%5 == 0:
			print 'sleep for one minute'
			time.sleep(60)
	return udic


def t_tweets_influencers(n):
	count = 0
	for i in range(n):
		if not i:
			udic = t_user_rank(retweet_users_of_a_tweet(t.t_id[i])) # first 3 users, 100 max
			follower = [udic.values()[x][0] for x in range(len(udic))]
			mention = [udic.values()[x][1] for x in range(len(udic))]
			score = [udic.values()[x][2] for x in range(len(udic))]
			keys = udic.keys()
			t_id = [t.t_id[i] for x in range(len(udic))]
			newdic = {'t_id':t_id,'influencer':keys,'score':score,'mention':mention,'follower':follower}
		else:
			udic = t_user_rank(retweet_users_of_a_tweet(t.t_id[i])) # first 3 users, 100 max
			follower = [udic.values()[x][0] for x in range(len(udic))]
			mention = [udic.values()[x][1] for x in range(len(udic))]
			score = [udic.values()[x][2] for x in range(len(udic))]
			keys = udic.keys()
			t_id = [t.t_id[i] for x in range(len(udic))]
			newdic['t_id'] += t_id
			newdic['influencer'] += keys
			newdic['score'] += score
			newdic['mention'] += mention
			newdic['follower'] += follower
		count += 1
		print '-------', count, 'of', n, 'tweets analyzed', '-------'
	return newdic

result = t_tweets_influencers(20) # first 2 popular tweets, 100 max
df = pd.DataFrame(result)
df.to_csv('influencers(10 posts).csv', encoding='utf-8')

print 'project is done!'
4. Record Superfans’ Preferences
Having recorded the influence scores for all retweet users, one quick way to label them in different categories is to associate their retweets with section/category information from the articles, and the twitter hashtags. With this information, editors can easily find the influencers within any category or topic.
Collect superfan data from every tweet:
- Scores
- Centrality – influence within one tweet
- InfluenceFlow – overall influence
- Interests
- Twitter Hashtags
- Article Sections (news/justice/voices…)
- Article Topics (drugs/transgender/mexico…)
- …
import pandas as pd
import matplotlib.pyplot as plt
import numpy as np
import tweepy
import requests
from collections import defaultdict
import re
import time
from tweepy import OAuthHandler
from get_config import get_config
env = get_config()
consumer_key = env.get('CONSUMER_KEY')
consumer_secret = env.get('CONSUMER_SECRET')
access_token = env.get('ACCESS_TOKEN')
access_secret = env.get('ACCESS_TOKEN_SECRET')
auth = OAuthHandler(consumer_key, consumer_secret)
auth.set_access_token(access_token, access_secret)
api = tweepy.API(auth)
t = pd.read_csv('fetcher/top100.csv')
u = pd.read_csv('influencers/influencers(20 posts).csv')
t1 = t.loc[:,['t_id','w_tags_section','w_tags_topic','t_hashtags']].iloc[:20,:]
sections = []
for i in t1.w_tags_section:
if type(i) == str:
i = re.sub('"','',i)
[sections.append(x) for x in i.split(",")]
sections = list(set(sections))
topics = []
for i in t1.w_tags_topic:
if type(i) == str:
i = re.sub('"','',i)
[topics.append(x) for x in i.split(",")]
topics = list(set(topics))
hashtags = []
for i in t1.t_hashtags:
if type(i) == str:
[hashtags.append(x) for x in i.split(",")]
hashtags = list(set(hashtags))
# set influence score threshold as 2000 (about 8% ~ 9% in the top)
u1 = u.loc[u.score&amp;gt;=2000]
u1 = u1.loc[:,['t_id','influencer']]
index = list(set(u1.influencer.values))
users = pd.Series(np.zeros(len(index)),index=index)
# check out how the result mapping looks like in mapping.csv
mapping = dict()
for section in sections:
mapping[section] = users
for topic in topics:
mapping[topic] = users
for hashtag in hashtags:
mapping[hashtag] = users
mapping = pd.DataFrame(mapping)
df = pd.merge(t1,u1)
for row_index,row in df.iterrows():
features = []
if type(row['w_tags_section']) == str:
section = re.sub('"','',row['w_tags_section'])
[features.append(x) for x in section.split(",")]
if type(row['w_tags_topic']) == str:
topic = re.sub('"','',row['w_tags_topic'])
[features.append(x) for x in topic.split(",")]
if type(row['t_hashtags']) == str:
[features.append(x) for x in row['t_hashtags'].split(",")]
for feature in features:
mapping.loc[row['influencer'],feature] += 1
print '\n', '------All features extracted from your top 20 retweets-------', '\n'
print 'Website sections:', sections, '\n'
print 'Website topics:', topics, '\n'
print 'Twitter hashtags:', hashtags, '\n'
while True:
m = raw_input('***** Which one to query? Choose from sections/topics/hashtags:')
if m == 'sections':
m = sections
break
elif m == 'topics':
m = topics
break
elif m == 'hashtags':
m = hashtags
break
else:
print 'Wrong format!'
print '\n', '***** Please choose one item from', m, ':'
n = raw_input('')
print '\n', '------Your Superfans who ever participated in that topic-------', '\n'
print mapping[(mapping[n]>0)]
print '\n', '------Influence Rank-------', '\n'
influencer = mapping[(mapping[n]>0)].index
x = pd.DataFrame({'influencer': list(influencer)})
result = pd.merge(x,u).loc[:,['influencer','follower','mention','score']].sort_index(by='score',ascending=False)
print result
5. Natural Language Processing and Recommendation System
To make this system more robust, two questions need to be answered properly in the future:
1). Is there a better way to predict user’s future interest?
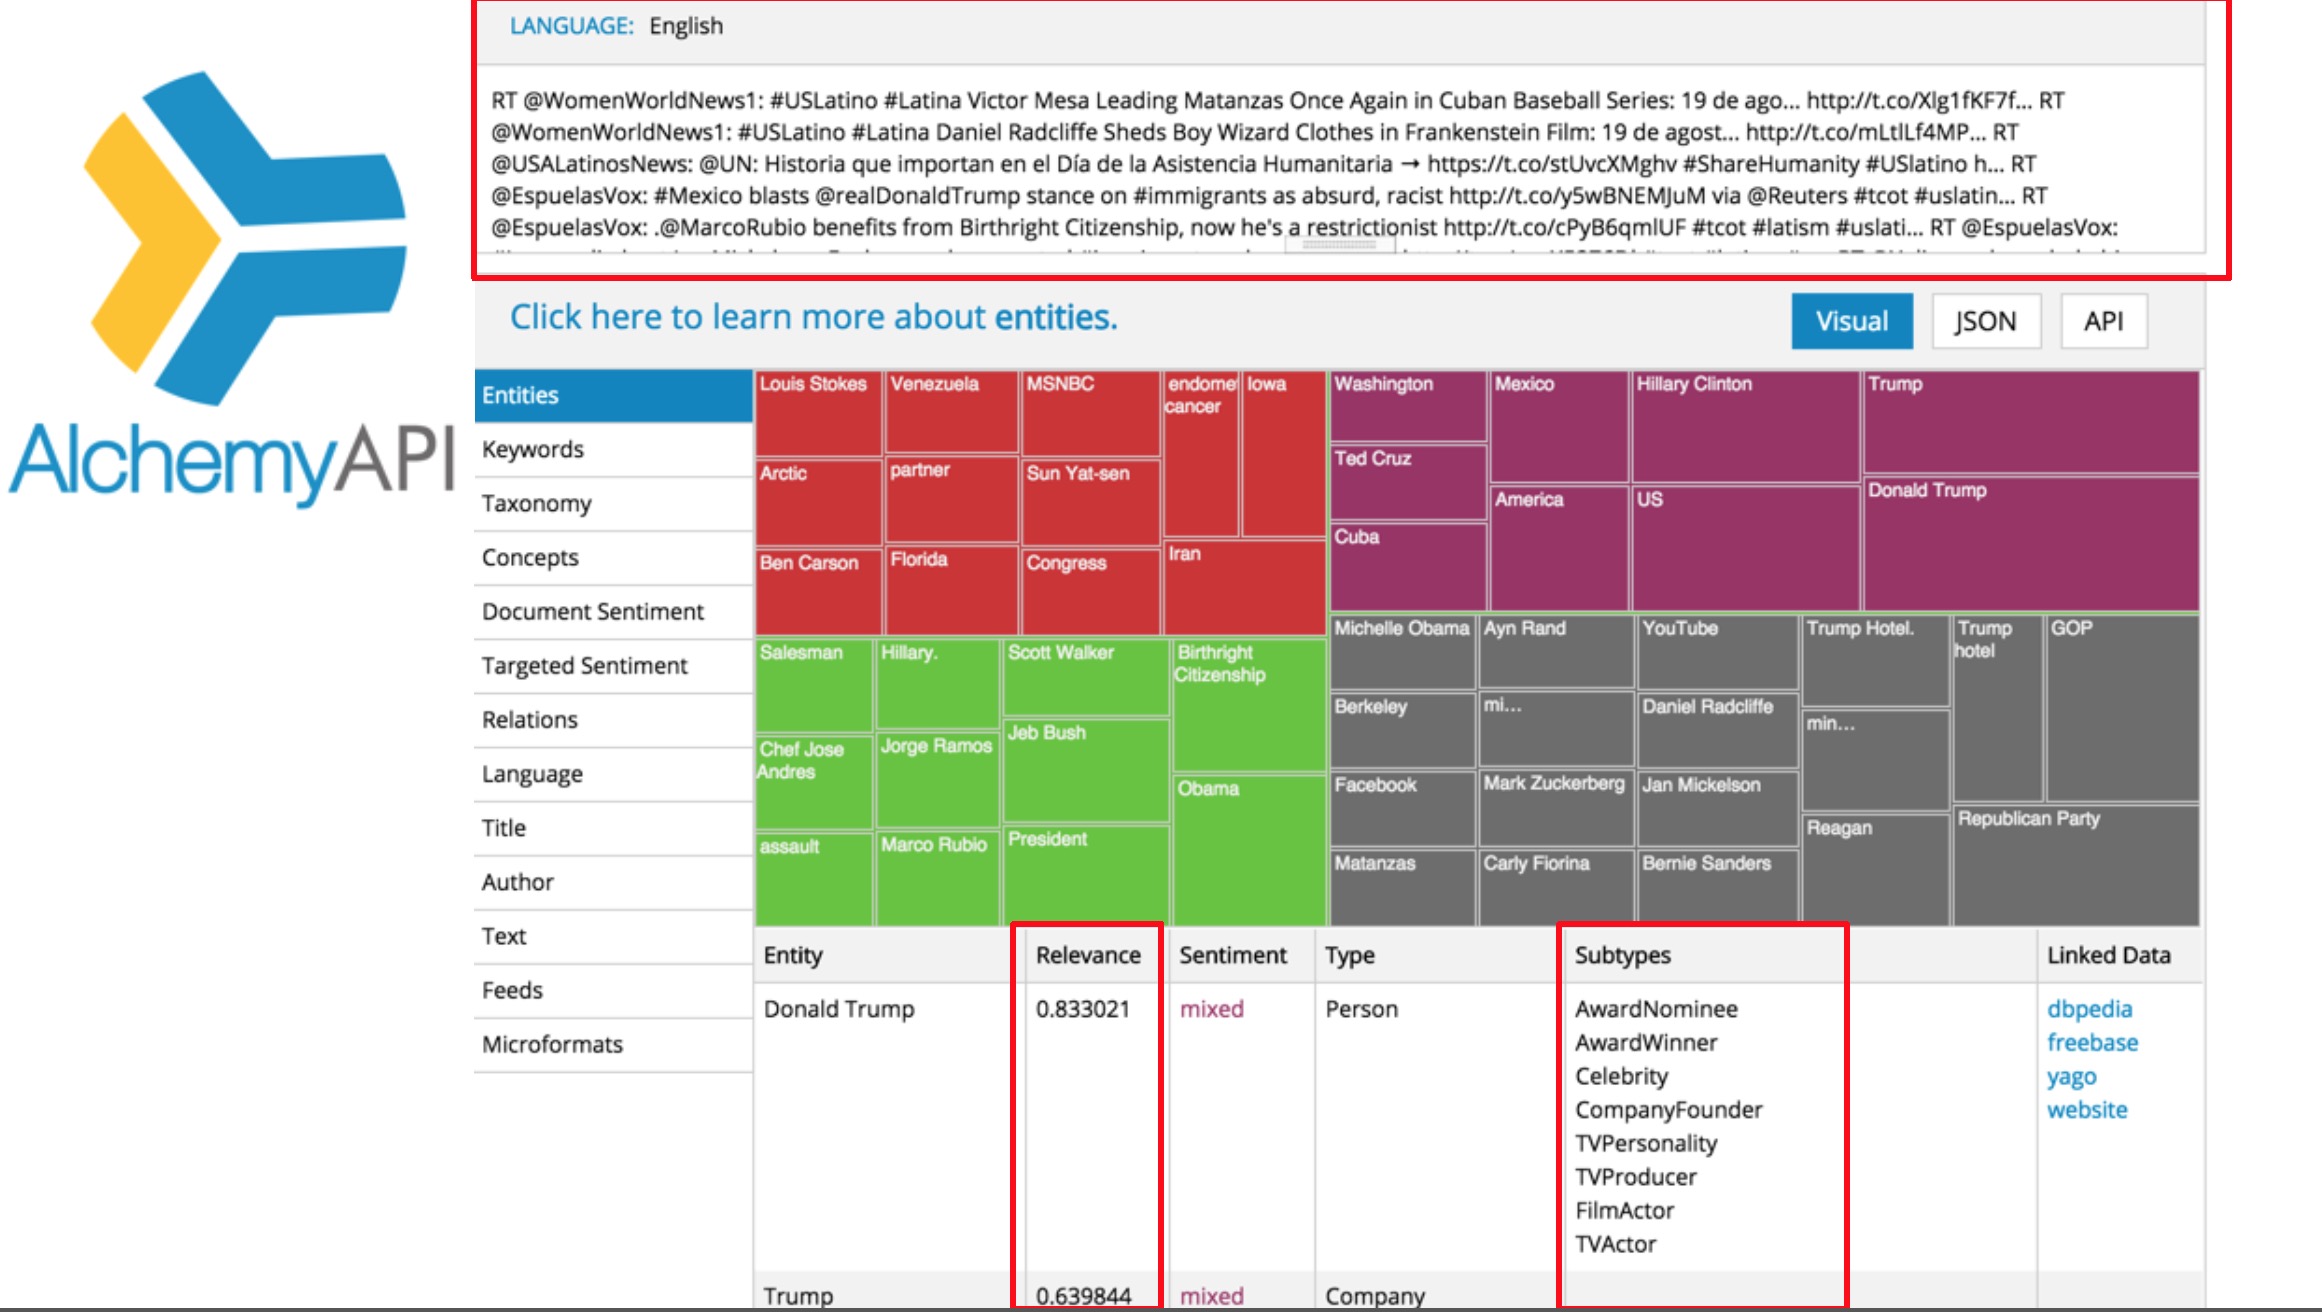
We’ve used the users’ past retweets as a basis to understand their interests. But the limited retweet records from one user may mislead the algorithm to give unbalanced weights to different topics. A better way is to analyze users’ own timeline using natural language processing tool. This way, the system can understand the user’s interest from everything he/she has participated in the past. To experiment, here we use AlchemyAPI as a NLP tool to extract entities and relevance scores from user timeline.

from __future__ import print_function
from alchemyapi import AlchemyAPI
import pandas as pd
import numpy as np
import json


i = pd.read_csv('itext.csv')

# Create the AlchemyAPI Object
alchemyapi = AlchemyAPI()

def get_subtypes(n):
	mining = dict()
	response = alchemyapi.entities('text', i.text[n], {'sentiment': 1})
	if response['status'] == 'OK':

	    for entity in response['entities']:
	        # print('relevance: ', entity['relevance'])
	        # print('text: ', entity['text'].encode('utf-8'))
	        # print('type: ', entity['type'])
	        if 'disambiguated' in entity.keys():
	        	if 'subType' in entity['disambiguated'].keys():
	        		for subtype in entity['disambiguated']['subType']:
	        			mining[subtype] = mining.get(subtype,0) + 1*float(entity['relevance'])
	else:
	    print('Error in entity extraction call: ', response['statusInfo'])
	return mining

def match_all(num):
	al = pd.DataFrame()
	for n in range(num):
		usern = pd.DataFrame(get_subtypes(n),index=[i.influencer[n]])
		al = al.append(usern)
		print('Processed',n+1,'of',num,'influencers')
	return al

al = match_all(len(i.influencer))
print(al)
al.to_csv('textmining.csv',encoding='utf-8')
print('Project is done!')
2). Is there an algorithm to suggest personalized recommendations to superfans?
Based on the same idea of natural language processing from the previous question, a content-based recommendation system can be built in following steps:
● Text mining on all superfans timeline content
● Clustering texts on vectors from AlchemyAPI
● Observe distributions of superfan scores and interests in different clusters
● Content-based recommendation (match vectorized user timeline text and article text using cosine similarity)
6. Limitations
Readers of this blog need to be cautious that because of the time and data limit, results from this project may be subject to certain bias.
- Time Limit (3-week-project)
- Mainly focused on identifying and classifying superfans
- Didn’t include time analysis
- Data Limit (Twitter API limitations)
- Rate limit – takes 1 to 2 days to get basic data needed for 20 tweets
- Query limit – can’t retrieve more than 3,200 tweets and 100 retweets, which sacrificed the flexibility of popularity analysis
- Lack of infrastructure support – data consistency issue occurred a lot
