
Why visualize an accident map?
As a Citi Bike annual member, I’ve always been proud of contributing to the poor 21% female rider ratio (source). But at the same time, I constantly got warnings from friends and family, “Streets in NYC are crazy! Biking is a bad idea!” How many biking accidents have actually happened compared to other vehicles? Where are the most dangerous intersections? When I saw the NYPD Vehicle Collision dataset, immediately, I came up with the idea to make this shiny app, deciding to detect road danger by open data.
Beyond my question, the app can answer much more: Have Ambulances caused injuries before? Are there any accidents associated with scooters? Where are the most dangerous intersections? What about road safety in your neighborhood? Click here to play: http://216.230.228.88:3838/Bootcamp2-Project/Shiny-Project/Fangzhou/ (check User Manual if needed)

(To my question, it seems that the most dangerous area for bikers would be east village and downtown area, where the accidents happened the most often. In half of the cases, bike riders would get into an accident with passengers. In the other half, the accidents would happen between bike riders and Taxis. The average injury is 1 person (although the injured party in the two cases might be quite different). The injuries are greater than buses and motorcycles (which are rare in the city), but smaller than taxis and passengers related accidents.)
Data Visualization by Shiny in R:
Click here to play: https://funjo.shinyapps.io/NYPD_accidents_shiny
Read User Manual: User Manual
Project source code: https://github.com/funjo/NYPD_accidents_shiny
Fangzhou Cheng – Copyright @ 2015, All Rights Reserved
Data Source
Source: NYPD Motor Vehicle Collisions | NYC Open Data.
Description: Data Details of Motor Vehicle Collisions in New York City provided by the Police Department (NYPD).
Usage: Original dataset was downloaded on 07/07/2015, containing 618,358 accident records from 07/01/2012 to 07/05/2015. Because of the loading speed concern, this app uses only 10,000 random records from the original dataset.
How to play?
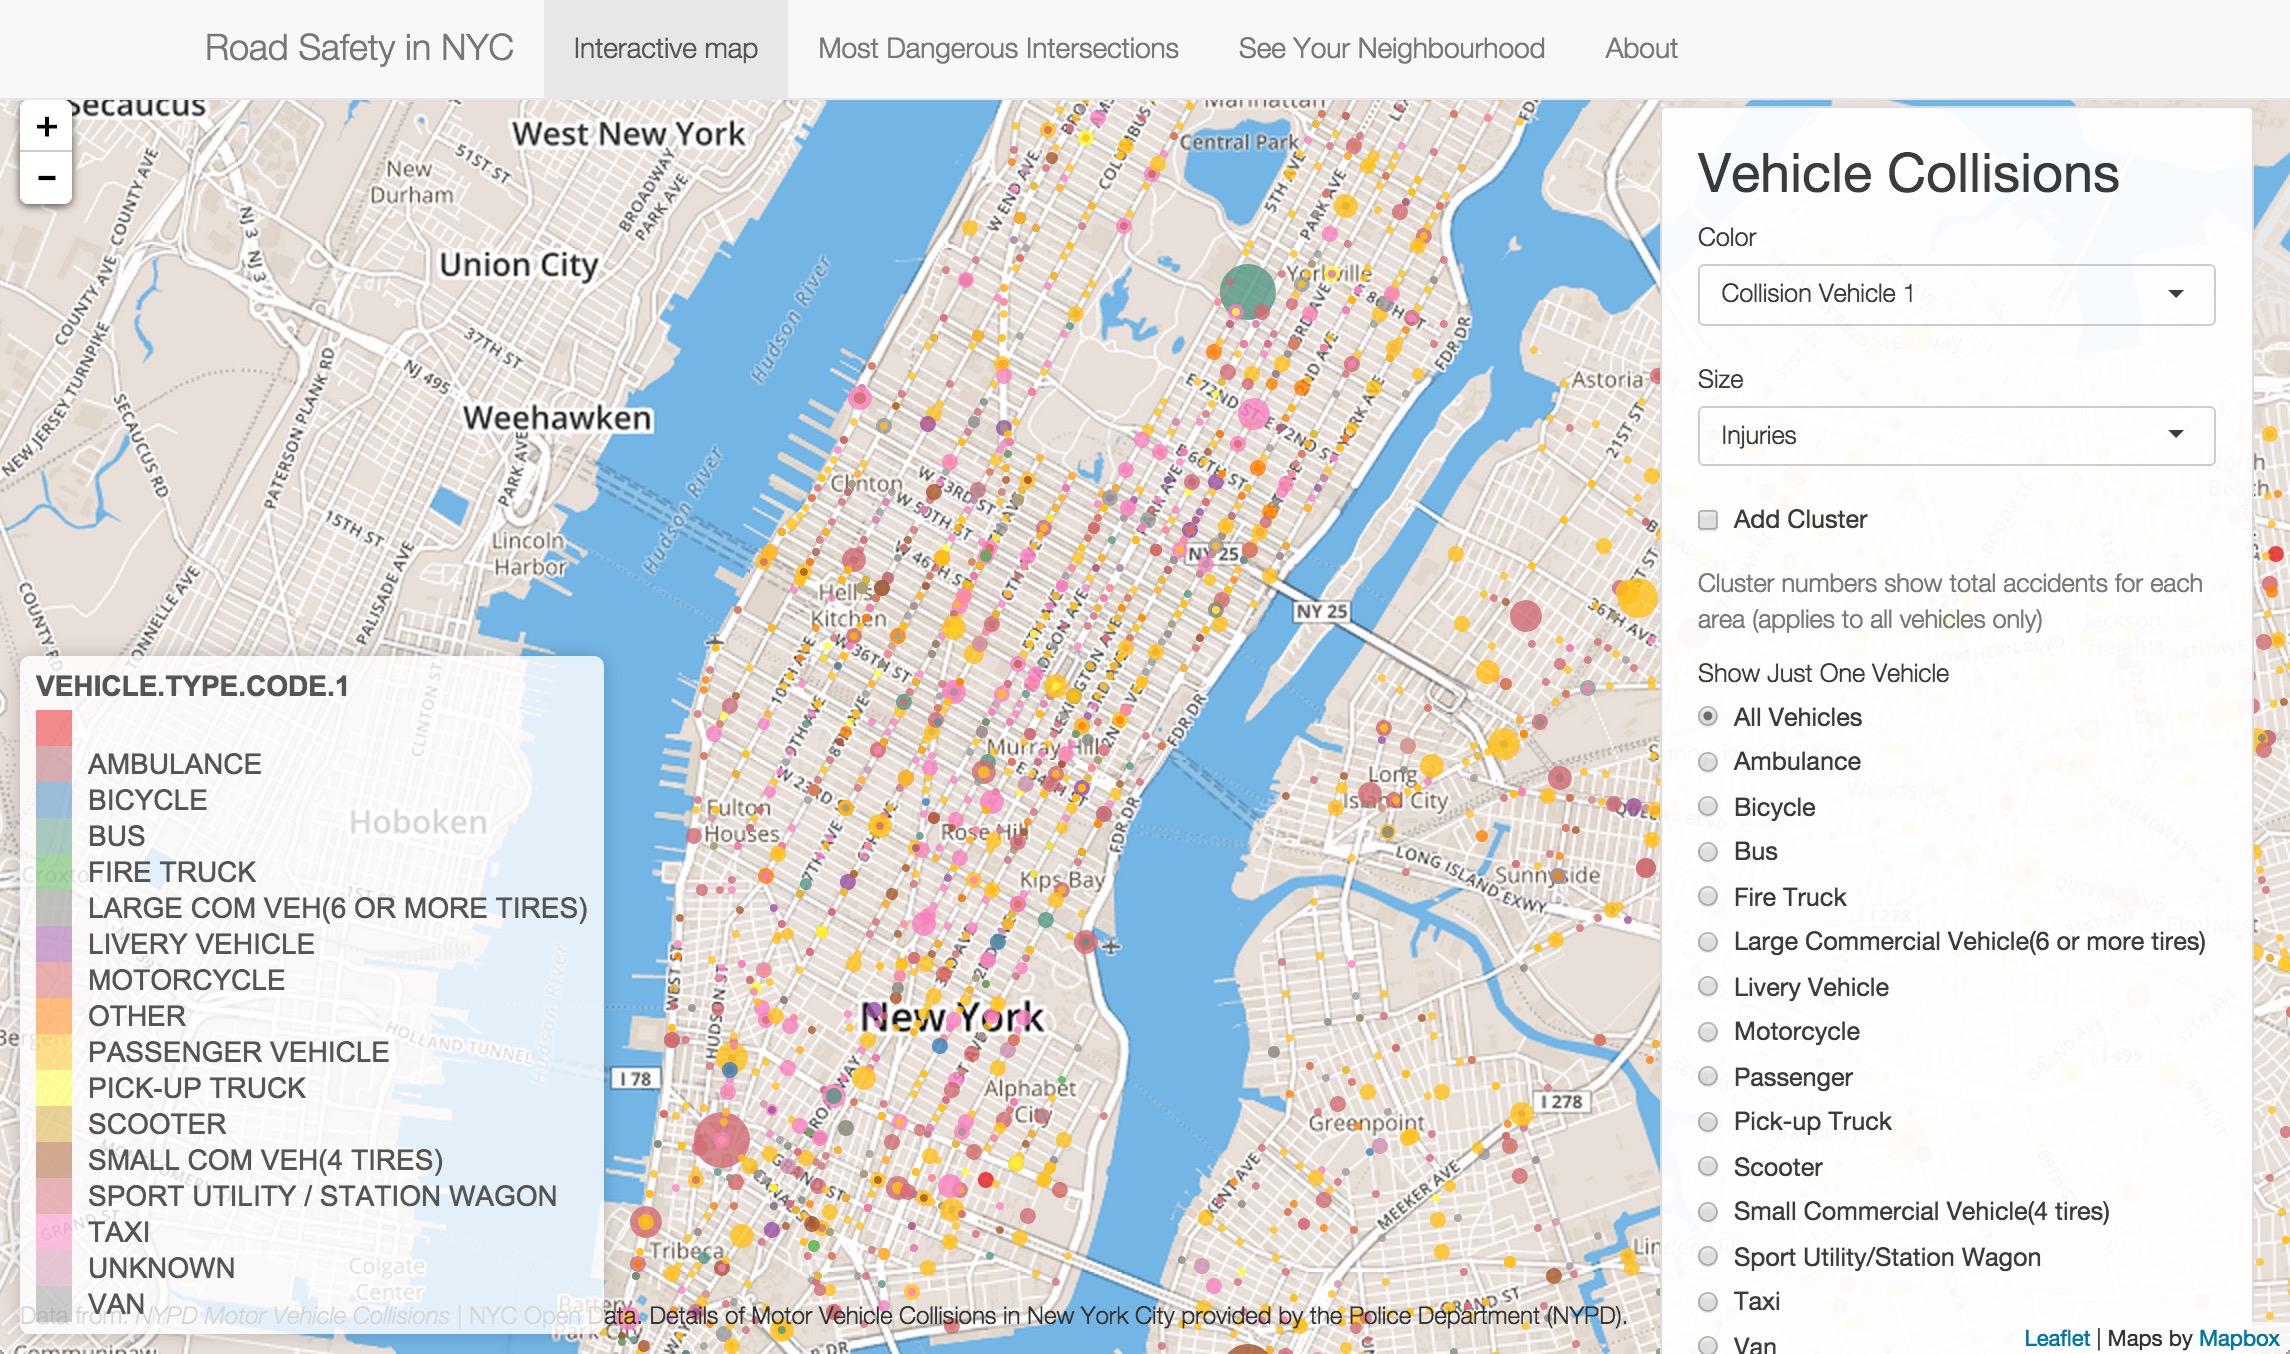
Step 1. Check how accidents happened in NYC
Every circle on the map indicates one intersection (unique combination of latitude and longitude) that had at least one accident in the past. Click on each circle to find out the time, vehicle types, and contributing factors to the accidents.
Commonly Asked Qeustions:
Can I see injuries/deaths for all types of vehicle?
Yes. For example, set [Color: Collision Vehicle 1 + Size: Injuries (default)]
Different colors = different vehicles (1 means it’s the first recorded one in the 2-vehicle collision);
Bigger spots have more injuries.
The map is too colorful. Can I switch to a simple heat map?
Yes. Set color and size input equal. For example, set [Color: Injuries + Size: Injuries]
There can be 0 injury in an accident!
Can I explore total accidents by region?
Yes. Check Add Cluster
Can I see results for just one type of vehicle (e.g, bike/passenger/bus/taxi/ambulance)?
Yes. Check Radio Button
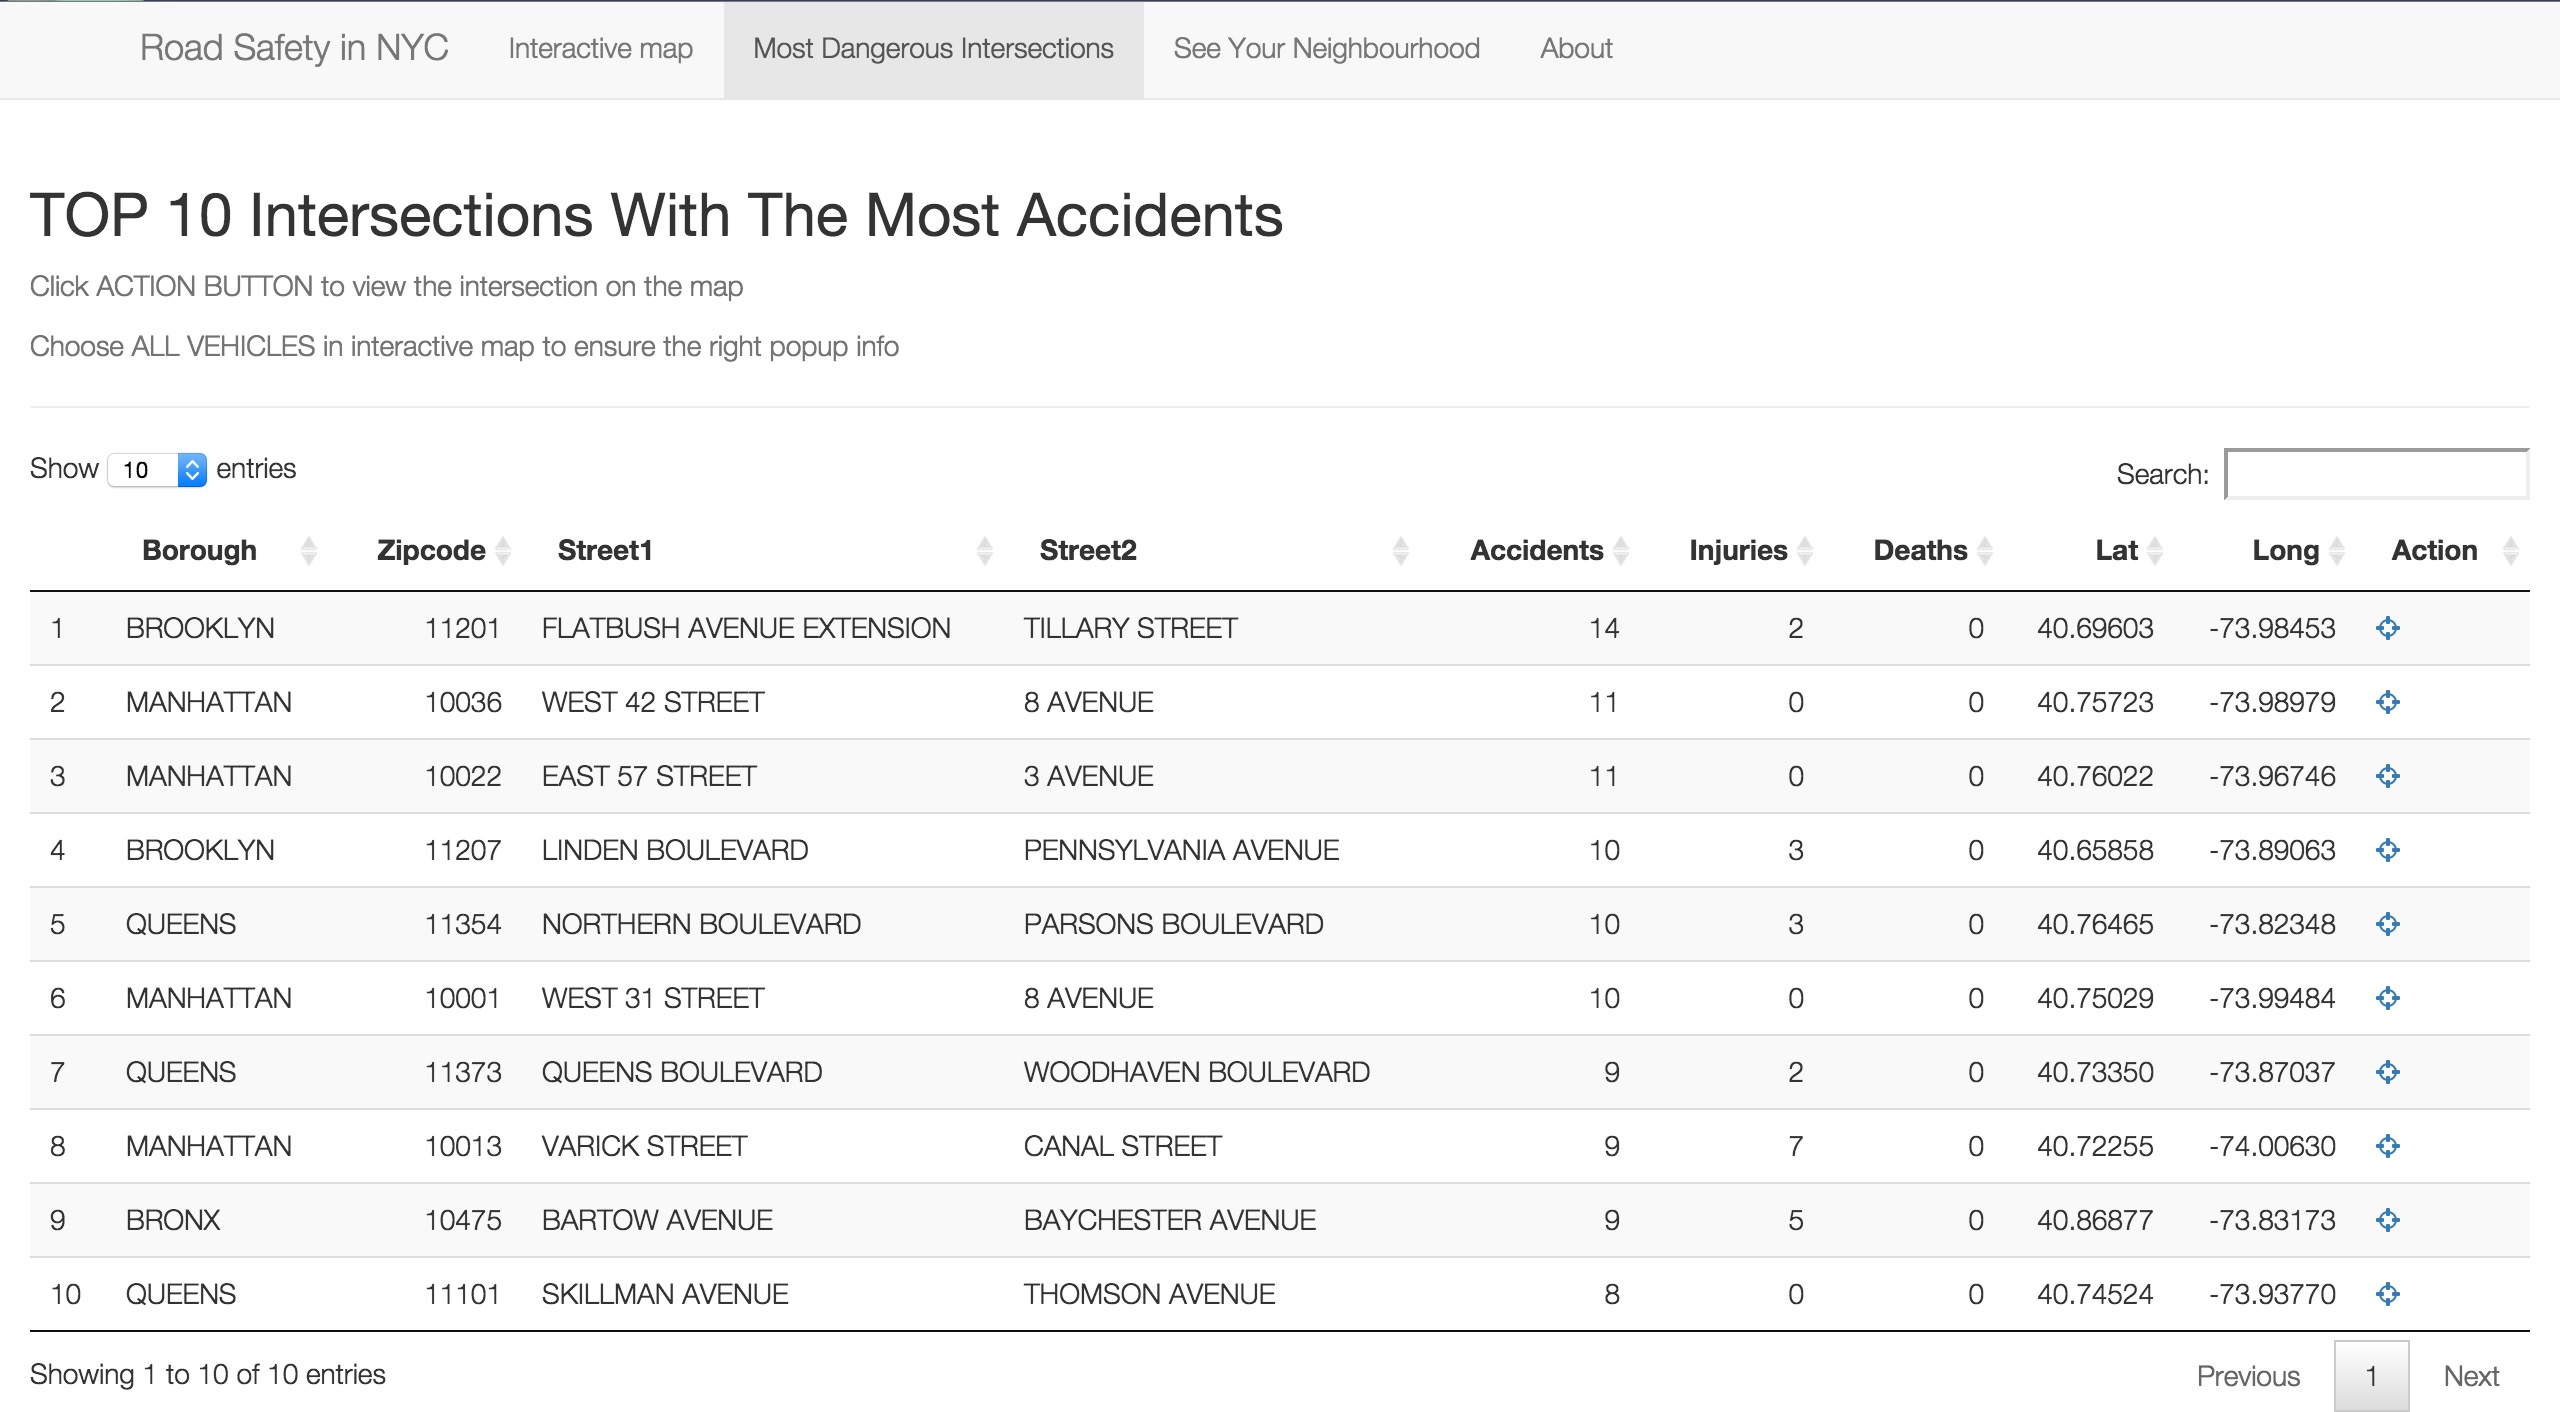
Step 2. Check the TOP 10 most dangerous intersections
Calculation Rules:
* Ranked by the total number of accidents happened at the same latitude and longitude
* Among all boroughs in NYC
* Note the dataset is only 10,000 random records of 618,358 accidents from 07/01/2012 to 07/05/2015
Commonly Asked Qeustions:
How do I find the corresponding spot in the map?
If you click the Action icon in the table, the app will redirect you to the corresponding spot on the interactive map.
This redirection function is cool. How did you implement it?
The map is generated on top of a leaflet map. The table here is generated on top of a data table. Both of them are very powerful visualization packages in R. The action button in the data table is essentially a line of javascript code. When you clicks the locator icon, the line of javascript code will carry the latitude and longitude in the table to the go-map class defined in gomap.js. What gomap.js does is to automatically simulate a user click on the corresponding latitude and longitude spot on the map, which calls back to the popup function defined in server.R.
That’s how you automate a remote click! Here is the code.
output$toptable <- DT::renderDataTable({
df <- read.csv('data/Most_Dangerous_Intersections.csv') %>%
mutate(Action = paste('<a class="go-map" href="" data-lat="', Lat, '" data-long="', Long, '" data-zip="', Borough, '"><i class="fa fa-crosshairs"></i></a>', sep=""))
action <- DT::dataTableAjax(session, df)

DT::datatable(df, options = list(ajax = list(url = action)), escape = FALSE)
})

})
################### gomap.js ###################
// When locator icon in datatable is clicked, go to that spot on the map
$(document).on("click", ".go-map", function(e) {
 e.preventDefault();
 $el = $(this);
 var lat = $el.data("lat");
 var long = $el.data("long");
 var zip = $el.data("zip");
 $($("#nav a")[0]).tab("show");
 Shiny.onInputChange("goto", {
 lat: lat,
 lng: long,
 zip: zip,
 nonce: Math.random()
 });
});
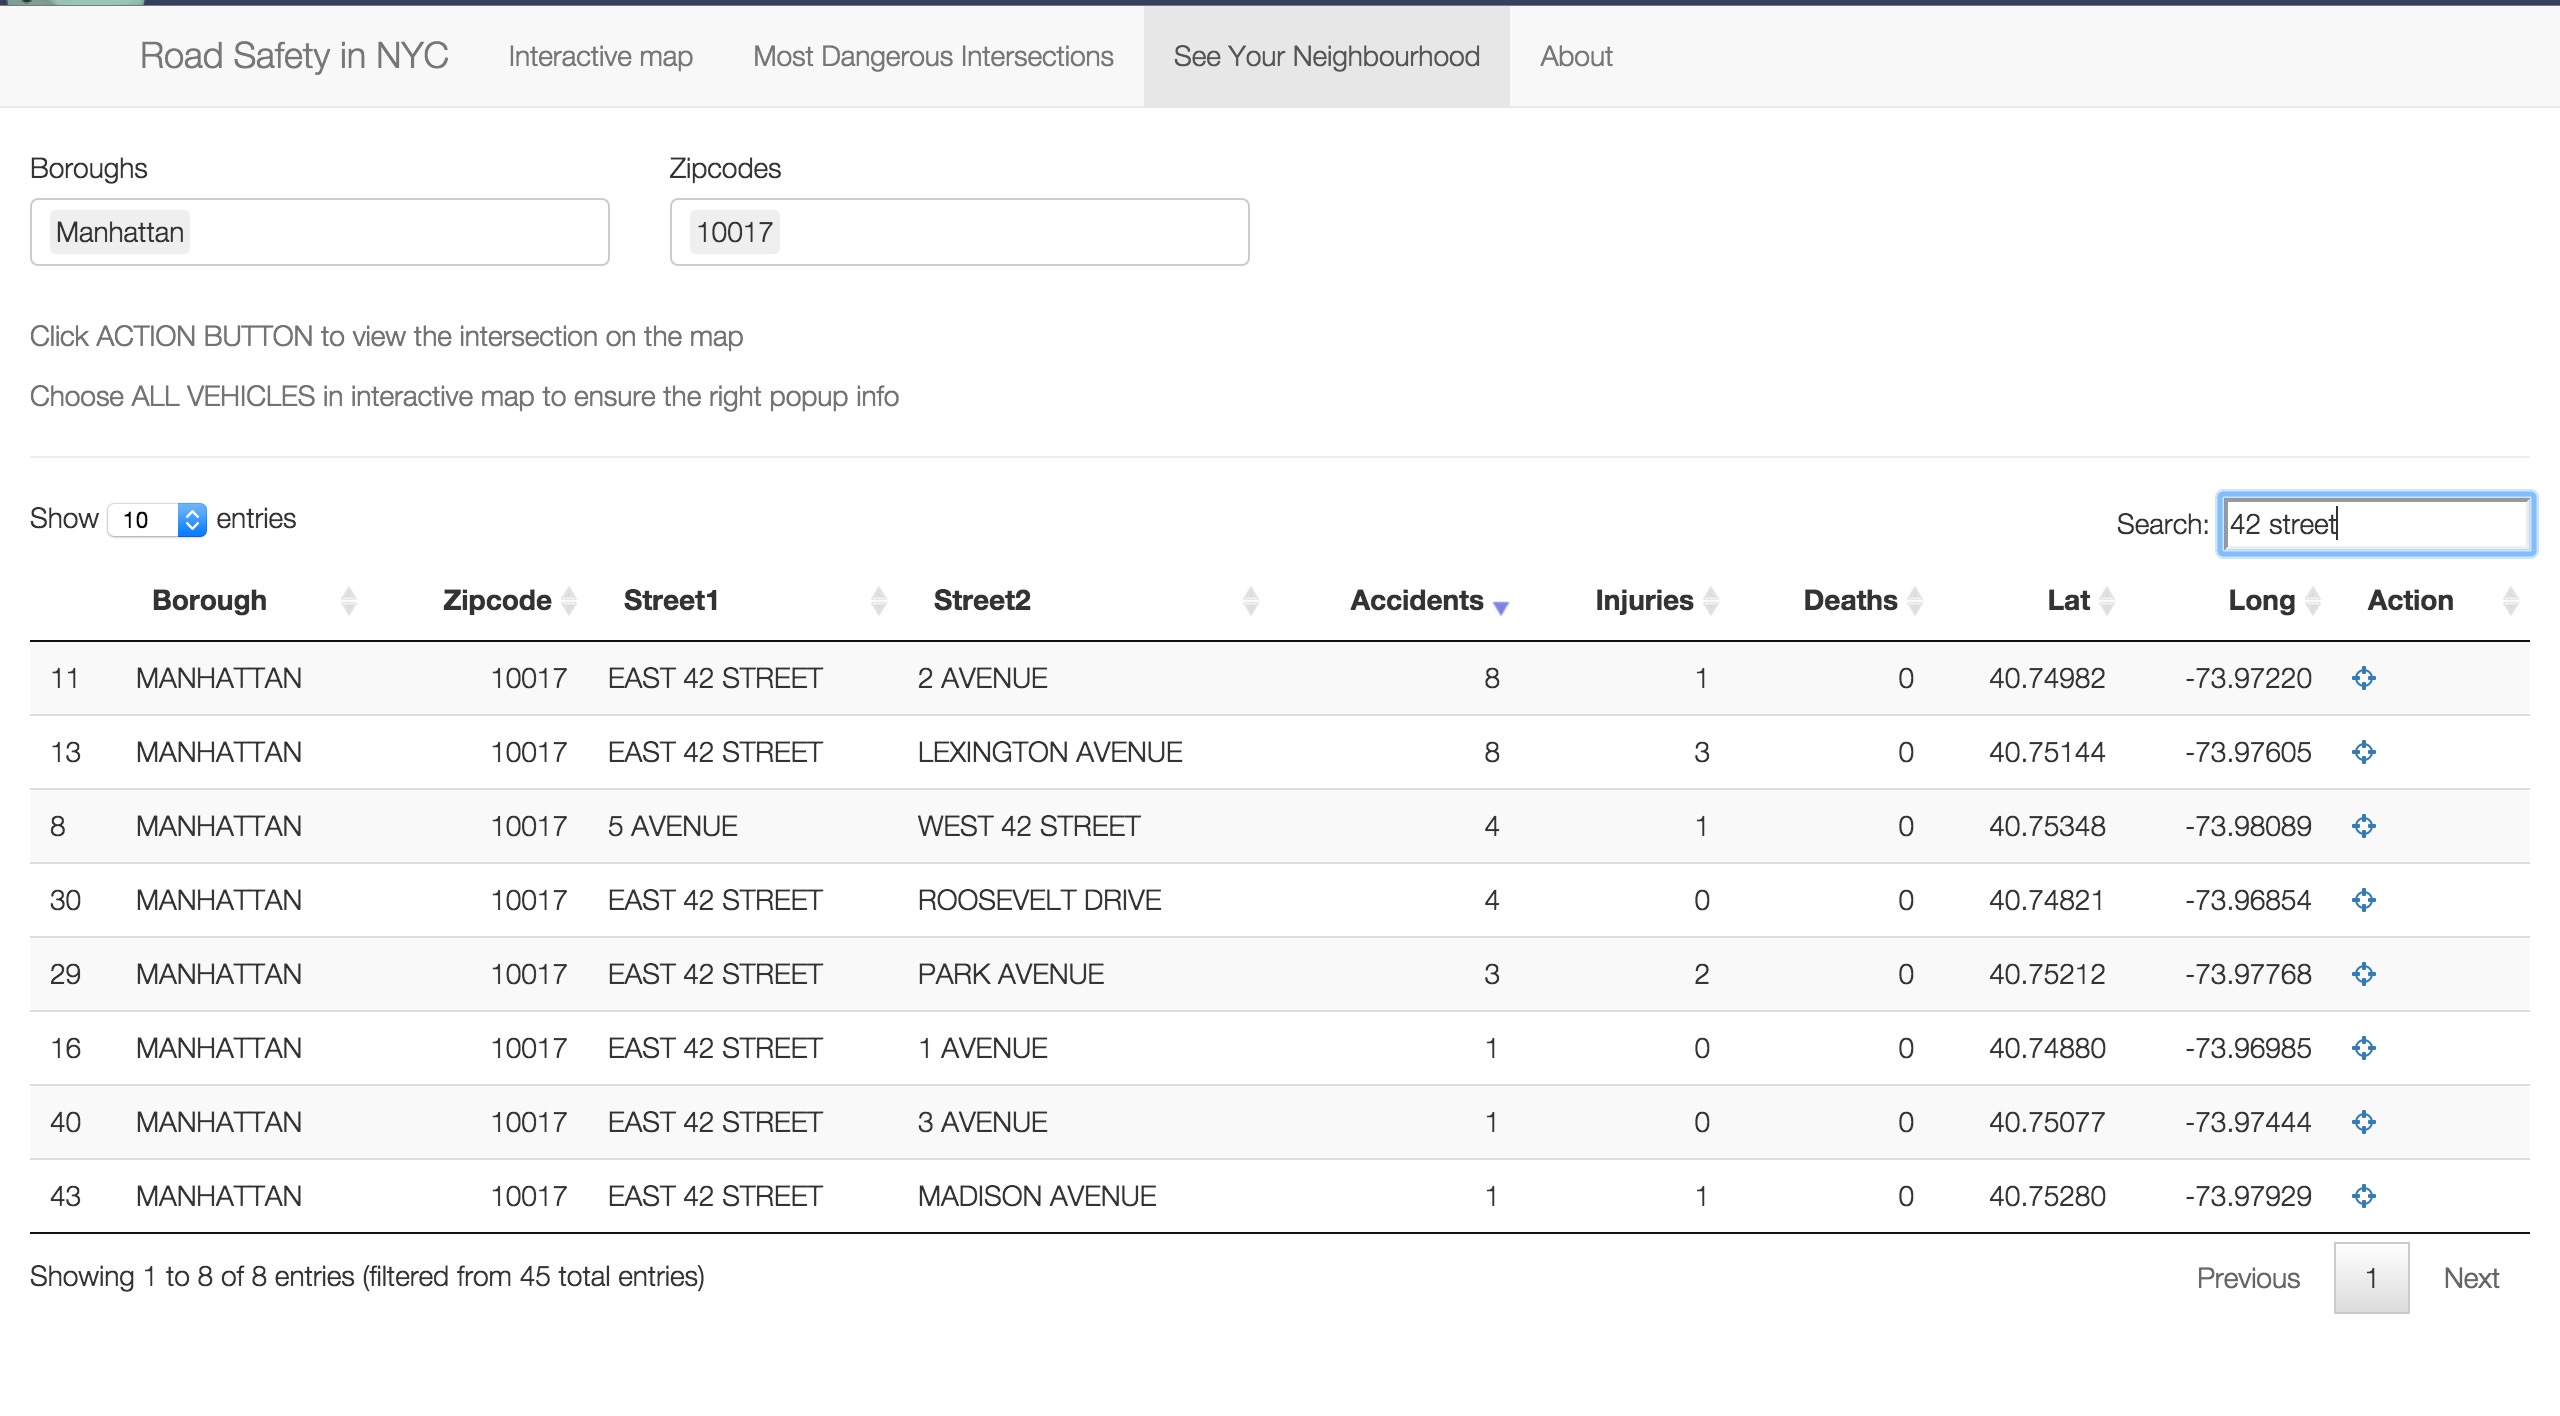
Step 3. Finally, check the safety in your neighborhood!
Locate by Borough/Zip Code:
Use top input boxes
Locate by Street Name:
Use search box
Sort by Accidents/Injuries/Deaths:
Click column name in table header
View Location in the Map:
Click the Action icon in the table
How was this app designed?
This shiny app contains 5 main coding documents and a data folder. The map in the app is powered by Leaflet.
ui.R defines the user interface in the front-end, including panels, sidebars, user input options, map and table display, as well as help texts.
################### ui.R #######################
library(shiny)
library(leaflet)

# Choices for drop-downs
vars <- c(
 'Collision Vehicle 1' = 'VEHICLE.TYPE.CODE.1',
 'Collision Vehicle 2' = 'VEHICLE.TYPE.CODE.2',
 "Injuries" = "NUMBER.OF.PERSONS.INJURED",
 "Deaths" = "NUMBER.OF.PERSONS.KILLED"
 )

vars2 <- c(
 "Injuries" = "NUMBER.OF.PERSONS.INJURED",
 "Deaths" = "NUMBER.OF.PERSONS.KILLED"
)

vars3 <- c(
 "All Vehicles" = "",
 "Ambulance" = "AMBULANCE",
 "Bicycle" = "BICYCLE",
 "Bus" = "BUS",
 "Fire Truck" = "FIRE TRUCK",
 "Large Commercial Vehicle(6 or more tires)" = "LARGE COM VEH(6 OR MORE TIRES)",
 "Livery Vehicle" = "LIVERY VEHICLE",
 "Motorcycle" = "MOTORCYCLE",
 "Passenger" = "PASSENGER VEHICLE",
 "Pick-up Truck" = "PICK-UP TRUCK",
 "Scooter" = "SCOOTER",
 "Small Commercial Vehicle(4 tires)" = "SMALL COM VEH(4 TIRES)",
 "Sport Utility/Station Wagon" = "SPORT UTILITY / STATION WAGON",
 "Taxi" = "TAXI",
 "Van" = "VAN"
)

vars4 <- c("All boroughs"="",
 'Manhattan'='MANHATTAN',
 'Brooklyn'='BROOKLYN',
 'Queens'='QUEENS','Bronx'='BRONX',
 'Staten Island'='STATEN ISLAND')

shinyUI(navbarPage("NYPD Vehicle Accidents Map", id="nav",

 tabPanel("Interactive map",
 div(class="outer",

 tags$head(
 # Include our custom CSS
 includeCSS("styles.css"),
 includeScript("gomap.js")
 ),

 leafletOutput("map", width="100%", height="100%"),

 # Shiny versions prior to 0.11 should use class="modal" instead.
 absolutePanel(id = "controls", class = "panel panel-default", fixed = TRUE,
 draggable = TRUE, top = 60, left = "auto", right = 20, bottom = "auto",
 width = 330, height = "auto",

 h2("Vehicle Collisions"),

 selectInput("color", "Color", vars),
 selectInput("size", "Size", vars2, selected = "NUMBER.OF.PERSONS.INJURED"),
 checkboxInput("cluster", "Add Cluster"),
 helpText("Cluster numbers show total accidents for each area",
 "(applies to all vehicles only)"),
 radioButtons("vehicle", "Show Just One Vehicle", vars3, selected = '')
 ),

 tags$div(id="cite",
 'Data from: ', tags$em('NYPD Motor Vehicle Collisions'), ' | NYC Open Data.
 Details of Motor Vehicle Collisions in New York City provided by the
 Police Department (NYPD).'
 )
 )
 ),

 tabPanel("Most Dangerous Intersections",
 h2("TOP 10 Intersections With The Most Accidents"),
 helpText("Click ACTION BUTTON to view the intersection on the map"),
 helpText("Choose ALL VEHICLES in interactive map to ensure the right popup info"),
 hr(),
 DT::dataTableOutput("toptable")
 ),

 tabPanel("See Your Neighbourhood",
 fluidRow(
 column(3,
 selectInput("boroughs", "Boroughs", vars4, multiple=TRUE)
 ),
 column(3,
 conditionalPanel("input.boroughs",
 selectInput("zipcodes", "Zipcodes", c("All zipcodes"=""), multiple=TRUE)
 )
 )
 ),
 helpText("Click ACTION BUTTON to view the intersection on the map"),
 helpText("Choose ALL VEHICLES in interactive map to ensure the right popup info"),
 hr(),
 DT::dataTableOutput("vctable")
 ),

 tabPanel("About",
 h4("User Manual: ", a("Click Here", href=
 "http://nbviewer.ipython.org/github/funjo/NYPD_accidents_shiny/blob/master/User%20Manual.pdf")),
 br(),
 h4("Data Source"),
 p("Source: ",a("NYPD Motor Vehicle Collisions | NYC Open Data.",href=
 "https://data.cityofnewyork.us/Public-Safety/NYPD-Motor-Vehicle-Collisions/h9gi-nx95")),
 p("Description: ","Data Details of Motor Vehicle Collisions in
 New York City provided by the Police Department (NYPD)."),
 p("Usage: ","Original dataset was downloaded on 07/07/2015,
 containing 618,358 accident records from 07/01/2012 to 07/05/2015.
 Because of the loading speed concern, this app uses only 10,000 random records
 from the original dataset."),
 br(),
 h4("Author Information"),
 p("Fangzhou Cheng"),
 p("Email: fc982@nyu.edu"),
 p("Website:", a("http://www.fangzhoucheng.com",href="http://www.fangzhoucheng.com")),
 p("Github:", a("http://www.github.com/funjo",href="http://www.github.com/funjo")),
 p("LinkedIn:", a("http://www.linkedin.com/in/fangzhoucheng",href="http://www.linkedin.com/in/fangzhoucheng")),
 br(),
 br(),
 p("Fangzhou Cheng - Copyright @ 2015, All Rights Reserved")
 ),

 conditionalPanel("false", icon("crosshair"))
))
server.R designs the back-end support. Key functions include map size and color calculation, filter and cluster marker functions, popup design (multi-entry popup at given latitude and longitude), action button linkage and responsive searching function.
#################### server.R ####################
library(shiny)
library(leaflet)
library(RColorBrewer)
library(scales)
library(lattice)
library(dplyr)

draw <- vc

shinyServer(function(input, output, session) {

## Interactive Map ###########################################

# Create the map
output$map <- renderLeaflet({
leaflet() %>%
addTiles(
urlTemplate = "//{s}.tiles.mapbox.com/v3/jcheng.map-5ebohr46/{z}/{x}/{y}.png",
attribution = 'Maps by <a href="http://www.mapbox.com/">Mapbox</a>'
) %>%
setView(lng = -73.97, lat = 40.75, zoom = 13)
})

# Choose just one vehicle
drawvalue <- reactive({if (input$vehicle == ''){return(vc)}else{
t <- filter(vc, VEHICLE.TYPE.CODE.1 == input$vehicle | VEHICLE.TYPE.CODE.2 == input$vehicle)
return(t)
}})

# This observer is responsible for maintaining the circles and legend,
# according to the variables the user has chosen to map to color and size.
observe({

colorBy <- input$color
sizeBy <- input$size
draw <- drawvalue()

colorData <- draw[[colorBy]]
if (colorBy == "NUMBER.OF.PERSONS.INJURED"|colorBy == "NUMBER.OF.PERSONS.KILLED") {
pal <- colorBin(heat.colors(7), colorData, 7)} else{
pal <- colorFactor("Set1", colorData)
}

radius <- draw[[sizeBy]] / 9 * 250 + 30

if (input$cluster == TRUE){
leafletProxy("map", data = draw) %>%
clearShapes() %>%
showGroup('Cluster') %>%
addCircles(~LONGITUDE, ~LATITUDE, radius=radius, group = "Circle",
stroke=FALSE, fillOpacity=0.8, fillColor=pal(colorData)) %>%
addCircleMarkers(~LONGITUDE, ~LATITUDE, radius = 0, group = "Cluster",
clusterOptions = markerClusterOptions())%>%
addLegend("bottomleft", pal=pal, values=colorData, title=colorBy,
layerId="colorLegend")
}else{
leafletProxy("map", data = draw) %>%
clearShapes() %>%
hideGroup('Cluster') %>%
addCircles(~LONGITUDE, ~LATITUDE, radius=radius, group = "Circle",
stroke=FALSE, fillOpacity=0.8, fillColor=pal(colorData)) %>%
addLegend("bottomleft", pal=pal, values=colorData, title=colorBy,
layerId="colorLegend")
}
})

# Show a popup at the given location
showvcPopup <- function(eventid, lat, lng) {
draw <- drawvalue()
selectedvc <- filter(draw, LATITUDE == lat, LONGITUDE == lng)
entry <- function(row){
result <- as.character(tagList(
tags$h6(row[2], row[3]),
tags$strong(HTML(sprintf("%s & %s", row[9], row[10]))), tags$br(),
sprintf("Vehicles: %s & %s", row[26], row[27]), tags$br(),
sprintf("Factors: %s & %s", row[20], row[21]), tags$br(),
sprintf("%s Injuries & %s Deaths", row[12], row[13]), tags$br()))
return(result)
}
content <- apply(selectedvc, 1, entry)
content <- paste0(content, collapse = "\n")
leafletProxy("map") %>% addPopups(lng, lat, content, layerId = eventid)
}

# When map is clicked, show a popup with city info
observe({
leafletProxy("map") %>% clearPopups()
event <- input$map_shape_click
if (is.null(event))
return()

isolate({
showvcPopup(event$id, event$lat, event$lng)
})
})

## See Your Neighbourhood ###########################################

observe({
zipcodes <- if (is.null(input$boroughs)) character(0) else {
filter(cleantable, Borough %in% input$boroughs) %>%
`$`('Zipcode') %>%
unique() %>%
sort()
}
stillSelected <- isolate(input$zipcodes[input$zipcodes %in% zipcodes])
updateSelectInput(session, "zipcodes", choices = zipcodes,
selected = stillSelected)
})

# When actions is clicked, call popup function for the corresponding latitude and longitude
observe({
if (is.null(input$goto))
return()
isolate({
map <- leafletProxy("map")
map %>% clearPopups()
dist <- 0.02
zip <- input$goto$zip
lat <- input$goto$lat
lng <- input$goto$lng
showvcPopup(zip, lat, lng)
map %>% fitBounds(lng - dist, lat - dist, lng + dist, lat + dist)
})
})

output$vctable <- DT::renderDataTable({
df <- cleantable %>%
filter(
is.null(input$boroughs) | Borough %in% input$boroughs,
is.null(input$zipcodes) | Zipcode %in% input$zipcodes
) %>%
mutate(Action = paste('<a class="go-map" href="" data-lat="', Lat, '" data-long="', Long, '" data-zip="', Borough, '"><i class="fa fa-crosshairs"></i></a>', sep=""))
action <- DT::dataTableAjax(session, df)

DT::datatable(df, options = list(ajax = list(url = action)), escape = FALSE)
})

## Most Dangerous Intersections ###########################

output$toptable <- DT::renderDataTable({
df <- read.csv('data/Most_Dangerous_Intersections.csv') %>%
mutate(Action = paste('<a class="go-map" href="" data-lat="', Lat, '" data-long="', Long, '" data-zip="', Borough, '"><i class="fa fa-crosshairs"></i></a>', sep=""))
action <- DT::dataTableAjax(session, df)

DT::datatable(df, options = list(ajax = list(url = action)), escape = FALSE)
})

})
global.R handles data cleaning and initial loading function. It cleans up rows without geographic info, mutates the data frame to contain group aggregation columns (total accidents/injuries/deaths at given latitude and longitude), and provides table for ‘see your neighborhood’ panel.
####################### global.R #####################
library(dplyr)

# Data cleaning to get rid of records with no geo info
# Leaflet bindings are a bit slow; for now we'll just sample to compensate (10000 samples)
# Original data NYPD_Motor_Vehicle_Collisions.csv is 119.5 MB, which is too large to be included in this repo

############### Code ##############
# vc <- read.csv("data/NYPD_Motor_Vehicle_Collisions.csv") # 618,358 observations
# vc <- subset(vc,!(is.na(vc['ZIP.CODE']))) # 470,687 observations
# set.seed(100)
# vc <- vc[sample.int(nrow(vc), 10000),]
# write.csv(vc, file = 'data/NYPD_Motor_Vehicle_Collisions (10000 obs).csv')
###################################

# Import truncate data (vc is short for vehicle collision)

vc <- read.csv('data/NYPD_Motor_Vehicle_Collisions (10000 obs).csv')

#count number of accidents at the same location(latitude and longitude)
cleantable <- vc %>%
 group_by(LONGITUDE,LATITUDE) %>%
 mutate(count = n(),totalinjury = sum(NUMBER.OF.PERSONS.INJURED),
 totaldeath = sum(NUMBER.OF.PERSONS.KILLED))
cleantable <- cleantable[!duplicated(cleantable$LOCATION), ]

cleantable <- cleantable %>%
 select(
 Borough = BOROUGH,
 Zipcode = ZIP.CODE,
 Street1 = ON.STREET.NAME,
 Street2 = CROSS.STREET.NAME,
 Accidents = count,
 Injuries = totalinjury,
 Deaths = totaldeath,
 Lat = LATITUDE,
 Long = LONGITUDE)
styles.css provides the customized looking for the user interface.
####################### styles.css ####################
input[type="number"] {
 max-width: 80%;
}

div.outer {
 position: fixed;
 top: 41px;
 left: 0;
 right: 0;
 bottom: 0;
 overflow: hidden;
 padding: 0;
}

/* Customize fonts */
body, label, input, button, select {
 font-family: 'Helvetica Neue', Helvetica;
 font-weight: 200;
}
h1, h2, h3, h4 { font-weight: 400; }

#controls {
 /* Appearance */
 background-color: white;
 padding: 0 20px 20px 20px;
 cursor: move;
 /* Fade out while not hovering */
 opacity: 0.65;
 zoom: 0.9;
 transition: opacity 500ms 1s;
}
#controls:hover {
 /* Fade in while hovering */
 opacity: 0.95;
 transition-delay: 0;
}

/* Position and style citation */
#cite {
 position: absolute;
 bottom: 10px;
 left: 10px;
 font-size: 12px;
}

/* If not using map tiles, show a white background */
.leaflet-container {
 background-color: white !important;
}
gomap.js responses to the action button in the clean table. When user clicks the locator icon, it automatically changes shiny user input to call popup function in server.R.
################### gomap.js ###################
// When locator icon in datatable is clicked, go to that spot on the map
$(document).on("click", ".go-map", function(e) {
 e.preventDefault();
 $el = $(this);
 var lat = $el.data("lat");
 var long = $el.data("long");
 var zip = $el.data("zip");
 $($("#nav a")[0]).tab("show");
 Shiny.onInputChange("goto", {
 lat: lat,
 lng: long,
 zip: zip,
 nonce: Math.random()
 });
});
